Tableau
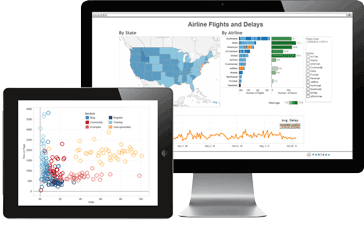
Connect to almost any database, drag and drop to create visualizations, and share with a click.
Tableau® helps the world’s largest organizations unleash the power of their most valuable assets: their data and their people.
With a balanced blend of technical skills, artistic flair and business acumen, we create & craft interactive dashboards to help you uncover hidden insights on the fly.
Learn more
Power BI
Business intelligence like never before.
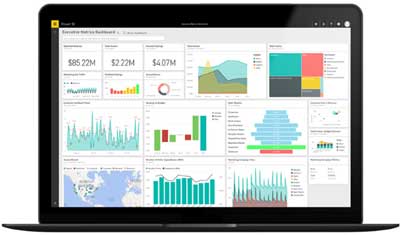
Power BI is a suite of business analytics tools that deliver insights throughout your organization. Connect to hundreds of data sources, simplify data prep, and drive ad hoc analysis.
Produce beautiful reports, then publish them for your organization to consume on the web and across mobile devices.
Learn more
Qlik
See the whole story.
Qlik® lets you create visualizations, dashboards, and apps that answer your company’s most important questions. Now you can see the whole story that lives within your data.
Whether in stand-alone mode or integrated with other visualization solutions, we leverage the power of Qlik to turn your data into actionable insights.
Learn more
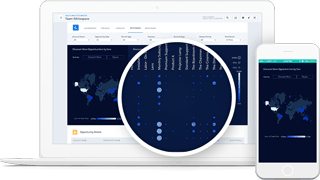
Salesforce Analytics
Business intelligence by Salesforce.com.
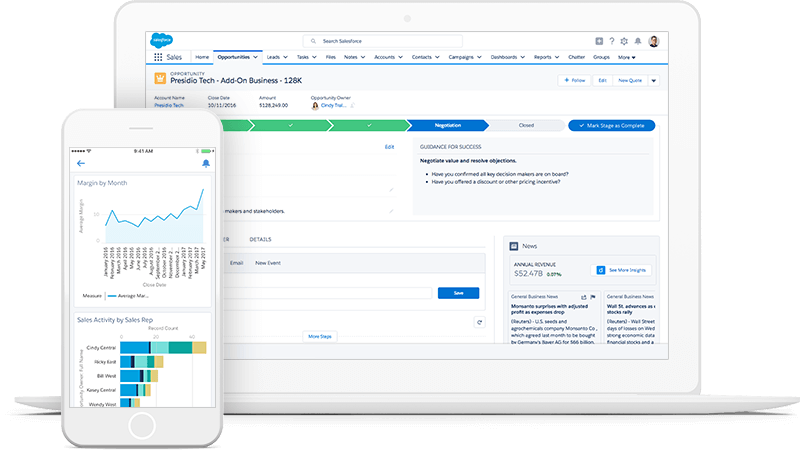
Salesforce Einstein Analytics — previously known as “Wave Analytics” — is a cloud-based platform for connecting data from all your Salesforce orgs, as well as external sources, creating interactive views of that data, and sharing those views in apps. It's a better way to distribute insight to business users so they can understand and take action on changing information.
Learn more
Linkurious
Leverage the Power of Connected Data.
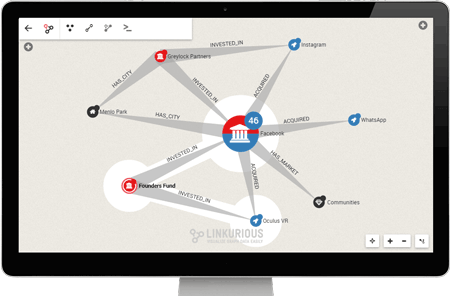
Linkurious® is an on-premise (for now) graph visualization and analysis software that helps government agencies and Fortune 500 companies identify and investigate insights hidden in complex connected data.
It is compatible with graph databases (AllegroGraph, DataStax, Neo4j, Titan) and comes with advanced security features and an extensible API.
Learn more
Services
Use Data Visualization to tell your Data Story.
Businesses have lots of data, in lots of formats, in lots of locations. Some of it is in the cloud, some of it is in legacy databases and some of it is in spreadsheets saved to desktops. With so many sources, it’s common that some information is left out, and only partial data makes its way to the final visualization stage.
Come to us when you need to understand your complex data in order to build an end visualization product that represents the data accurately and meets the goal of your organization.
Learn more
